The recent Superbowl re-surfaced annual discourse around how “Live” sports represent one of the last standing opportunities for brands and advertisers to reach large swathes of a population with a single, off-the-shelf ad-slot – where everyone is looking in the same direction at the same time.
Because of this the value of sports franchises and broadcasting rights are going through the roof and streaming services are stumbling over one another to acquire them – resulting in some serious inflationary pressure for advertisers looking to have a little squeeze of some of that high reaching, highly attentive juice.
Now I’m sure you all get the importance of advertising reach, but how do the choices we make as media planners impact how well it’s accumulated (or not) on an ongoing basis? Plus, how is it actually accumulated across channels and time?
Well that’s why for this post R is for…Reach
Where I’ll demonstrate how reach builds via a playing card analogy I first encountered during my Maths A-Levels, then stretch it to illustrate some common choices we make as media planners and their implications.
So, imagine you have a deck of 52 unique cards, no Jokers at this point.
Each card represents one person within your target audience.
Each card-draw represents a single ad-impression.
The end-game of this game that we’ll call ‘Reach & Frequency’ is to reach all 52 people in your target audience, or in this case draw every single card at least once.
Well that’s easy, it’s 52 card draws. Job done. On to Monopoly.
Well not with this game as here’s the kicker.
You have to draw every card blind
After each draw you have to put the card back in the pack and shuffle them
This makes the game more analogous with how advertising reach is accumulated, when ads are served indiscriminately on an impression-by-impression basis.
It’s also similar to a classic problem in probability theory known as the coupon, sticker or collector card conundrum; where the closer you get to completing your collection the harder it becomes to get the cards you need and the larger your “swaps” pile grows.

So, statistically speaking, how many card-draws should it take to draw all 52 cards?
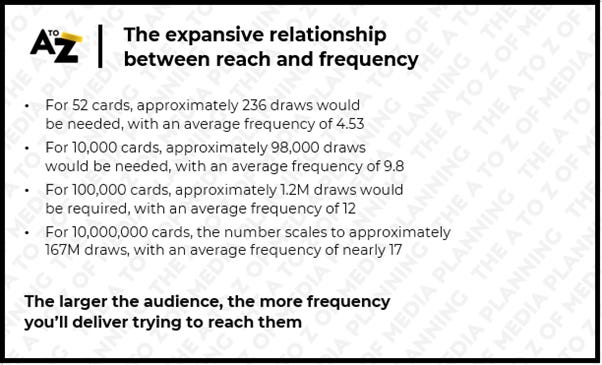
Well, the answer is 236.
A number which introduces the ying, to the yang of advertising reach, that is advertising frequency.
A relationship connected by a mathematical formula called Eular’s constant, that is present in compounding interest, the rate of spread in pandemics, the economics of collectible cards and of most significance **of course** how advertising reach and frequency is built in our world.
Where interestingly, the more people you reach, the higher the frequency is required to reach those additional people, as I’ve crudely laid out in the graphic below.
This relationship underpins two pieces of essential advertising theory that media planners must both grasp and have in-mind to make better choices on behalf of clients and colleagues.
#1 Advertising Reach Curves
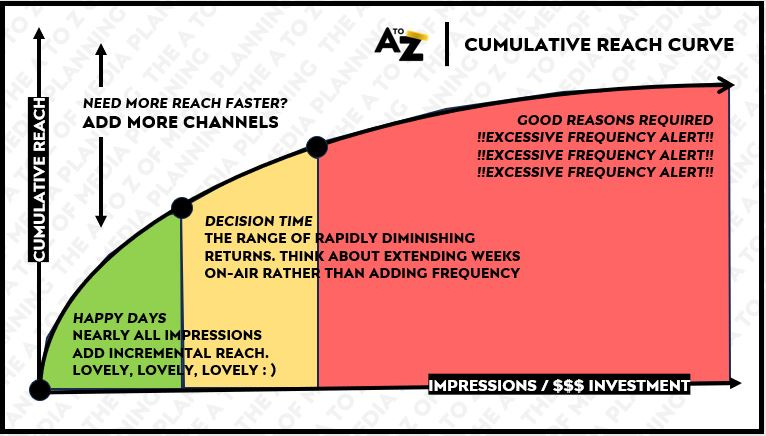
Which visualise the correlation between the size of a target audience, the availability of that audience in a channel/platform and how well incremental reach accumulates with every ad impression.
Take a look at an illustrative one below.
As you’ll see that lovely incremental reach is easy to come by when launching the campaign or entering a new time period, but the more impressions served, results in incremental reach becoming ever harder to come by.
Need reach faster? You’ll need to add more channels. Need reach more efficiently? Try incorporating channels where you can cap the frequency of messaging.
Understanding the varied composition of reach curves for different channels or channel mixes enables planners to anticipate the point of diminishing returns (in the orange zone above), where additional ad spend no longer significantly increases reach, but starts to accelerate frequency instead.
But much like some of the most desriable Pokemon cards, advertising frequency isn’t evenly distributed either; thus making it even more important to manage where possible in-time and across time.
Which neatly segues to the second piece of advertising theory I’d recommend getting to grips with.
#2 Advertising Frequency Distribution
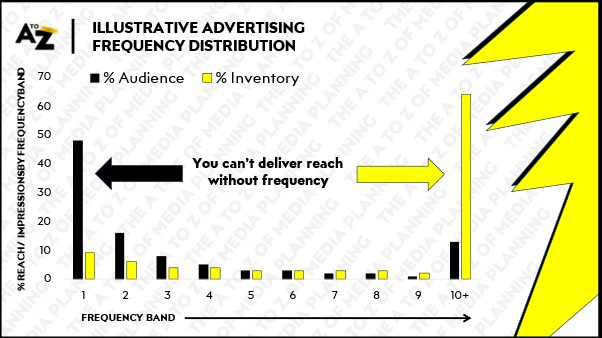
Which plots the proportion of inventory that is served vs. each frequency band.
As you’ll see in this illustrative example below, most people only experience the campaign one or two times; however the vast majority of the inventory is served against people who’ve seen the campaign 10+ times.
Therefore it might make more sense to use that money/inventory to extend the duration of the flight, rather than the weight of it.
Adjusting any ongoing reach targets by week accordingly.
Trying to find the sweet spot
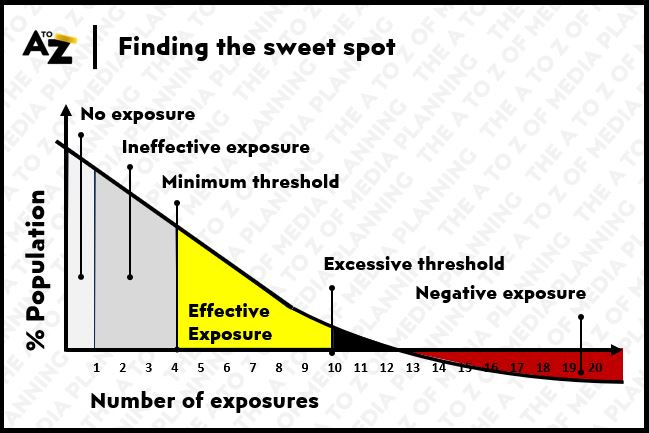
What ‘reach curves’ and ‘frequency distribution’ plots can help planners identify is whether a campaign is likely hitting the sweet spot between underexposure, where too few impressions fail to make an impact and excessive frequency where too many impressions can lead to audience annoyance, ad-fatigue or more importantly leave you without enough resources to extend exposure across other weeks / parts of a brand’s portfolio.
The onus is on us to help clients and colleagues establish where the sweet spot lies.
Which of-course will be different depending on the strength of the brand, the competition and wider market conditions; so be sure to establish your own parameters as part of any ongoing MMM work you might have in-play.
So, now you know the theory, let’s put it into practice
In four ways that hopefully demonstrate the implications of some of the choices we might make as media planners; in some deliberately exaggerated ways.
Stretching the original card-game analogy to make those implications a bit easier to digest.
#1 A Quickfire Game. Playing with a single suit = Advertising in a single platform
For kids and family members with dwindling attention spans who can’t be dealing with 236 card draws to end the game; here’s a quickfire version of it.
A version where you’re only allowed to draw from one suit — be it hearts, diamonds, clubs, or spades.
This approach is the equivalent to focusing your advertising solely on one media channel, like say TikTok.
This might be the right thing to do for youthful brands that are scaling up, as you’ll only need circa 20 or so card draws to complete this mini-version of the game, rather than 236, however for scaled brands and businesses you're essentially limiting your 'game' to just 13 cards (or one-quarter of the total deck/population) because you're only engaging with the segment of the population that uses that specific channel.
To make a crude comparison, a scaled brand may have enough resources for 236 card draws in the original version of this game, but if you choose to play with one suit, rather than reaching the whole population an average of 4.53 times, you’re actually only reaching 25% of the population an average of 9.44 times.
More groundhog day, than happy days…as illustrated by the graphic below.
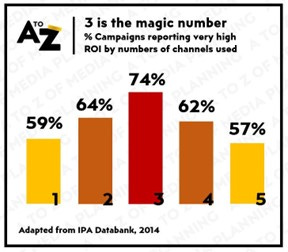
The point I’m making here is the importance of diversifying your media channels to maximize reach, minimising excessive frequency and ensuring you're not inadvertently excluding a significant portion of your potential audience who may be interested in what you have to offer and found elsewhere.
Evidence from the IPAs databank handily supports this assertion, meaning we should always think where possible ‘multi-channel’ by no means endless channels, to maximise campaign coherence and effectiveness.
#2 The Magic Card Draw. Spots vs. Dots
In the original card-game each card draw is an independent event, mirroring the one-to-one nature of digital advertising impressions - an approach that’s increasingly prevalent as we move towards a fully programmatic advertising landscape.
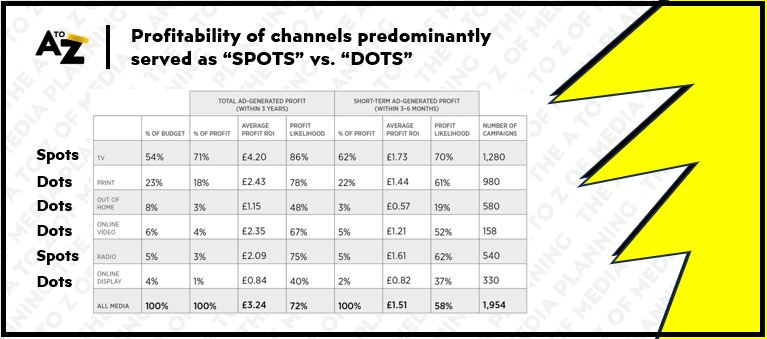
Yet, it's crucial to remember that a substantial portion of advertising today still relies on 'spots'—those moments when a single message is broadcast simultaneously to a broad audience through channels like TV or radio.
In-fact ‘spots’ are more often than not more effective than ‘dots’, as evidenced by this regularly cited piece of research by econometricians Gain Theory.
To help you grasp the significance of ‘spots’ vs. ‘dots’, from a logical perspective, let’s introduce a special twist in our card game, akin to performing a magic-card draw.
In this scenario, you have the ability to draw multiple cards at once.
This represents the power of broadcast advertising, where a single spot can reach multiple members of your audience simultaneously, thereby expanding your reach in a single leap rather than one card/impression at a time.
To bring this towards the real world through an example, a Superbowl spot reaches roughly half of U.S. households, hence would be the equivalent of drawing half the deck in our game with one draw.
Yes, it would be a more expensive draw for each equivalent impression, but to reach those 26 cards using individual draws would require 90 or so draws using the base method; requiring 3-4 times the volume of ad-impressions to reach the same number of people.
This shows why ‘spot’ advertising is an efficient way to accelerate or 'top up' your reach, ensuring a wide swathe of your target audience receives your message without the redundancy of excessive frequency; not even touching on the reputational qualities of being associated with the biggest entertainment events and with it brands and advertisers you’ll appear alongside… as brands just like people are judged by the company they keep.
This 'magic draw' concept contrasts and compliments the 'dots' of programmatic advertising, where each impression is a singular event, tailored and targeted but individually paced.
Both techniques have their place in a well-rounded media strategy; balancing the broad strokes of reach with the precision of targeted frequency and conversions.
#3 Introducing The Joker – Winning Fame & Virality
Continuing to juice the card game analogy, let's introduce another twist with the inclusion of the 'Jokers.'
These Jokers represent the potential of viral ads and activations within your marketing communications strategy.
Unlike the traditional approach of drawing single cards in hopes of reaching every card in the deck, these jokers have a unique power. When you draw one, it's like launching a viral ad or activation, which has the ability to draw/reach a vast portion of the deck—potentially the whole deck and ending that round of the game—in a single, impactful moment.
This mirrors how a well-crafted campaign can transcend traditional advertising barriers, achieving widespread visibility and engagement with minimal investment.
However, it's important to note the rarity and unpredictability of these jokers.
Just like viral success in the real world, their occurrence is not something you can plan for with certainty. They represent the aspirational, yet unpredictable, potential of content and experiences to spread and resonate at scale.
Which is why the last version of the game tends to have the most significant implications for media planning not just for a single campaign, but across campaigns and calendar years.
#4 Thinning the pack – Frequency Management & Flighting
Imagine that, in our pursuit to reach every card in the deck, we decide on one last rule change: once a card is drawn for the first time within a specific suit (say Clubs), it is removed from the deck for a set number of draws.
This mirrors the practice of ‘frequency capping’ in digital advertising, where certain vendors or ad-exchanges enable you to limit the number of times a single user is exposed to a campaign within a specific timeframe, which is often in a 30-day window with vendors like YouTube; a tactic to optimize ad spend, ensuring resources are directed towards expanding reach and/or weeks on-air rather than excessively retargeting the same individuals in the immediate timeframe.
If for instance the base-game at the start of this post takes 236 card draws to complete the deck, by having frequency capping in-place for a proportion of your inventory (with say the suit of clubs) will enable you to reach the whole deck, with significantly less draws overall.
Saving those draws for another game.
Thus, ensuring a more efficient and likely to be more effective distribution of advertising impressions.
But what about channels where it isn’t possible to manage frequency in this way?
Well this is where you start to adjust your reach targets on an ongoing basis to ensure you use more of your impressions, or card draws in our game, to reach more people, across more weeks, rather than reach the same people at higher weights.
As each brand only has finite ‘card draws’ across the year to play with.
This mimics a discipline we’ve come to term “Frequency Management” or “Flighting”; that if managed well won’t necessarily step-change the outcomes of your advertising, but if managed badly can easily destroy them.
Be sure to check out my earlier post in this series ‘F is for… Frequency’ where I walk through the choices you might make to reach significantly more people, in more resonant ways, with the same resources through better advertising flighting patterns.
With some steps anyone can take towards becoming a Jedi Flighter.
If you made it this far I really hope you’ve enjoyed this post; if you did please like/share/subscribe etc as it will help more people like you discover it.
Until next time,
Matt





Matt. I spent a happy career explaining this to people and you have done a far better job than I ever did. Nicely done.
Good post. Well explained.