A couple of weeks ago a good friend of mine ran the London Marathon.
Usually, I just go and clap the runners as I live near the start line, but this time I wanted to make sure I was in the right place at the right time to see him go past.
To help supporters manage this, The London Marathon app uses data generated by the shoelace chip to create a live read on where the runners are on their route, their average pace and projected finish time, so you can figure out roughly where you need to be by when to clap them on.
Doing this across 50,000 runners in real-time is pretty clever.
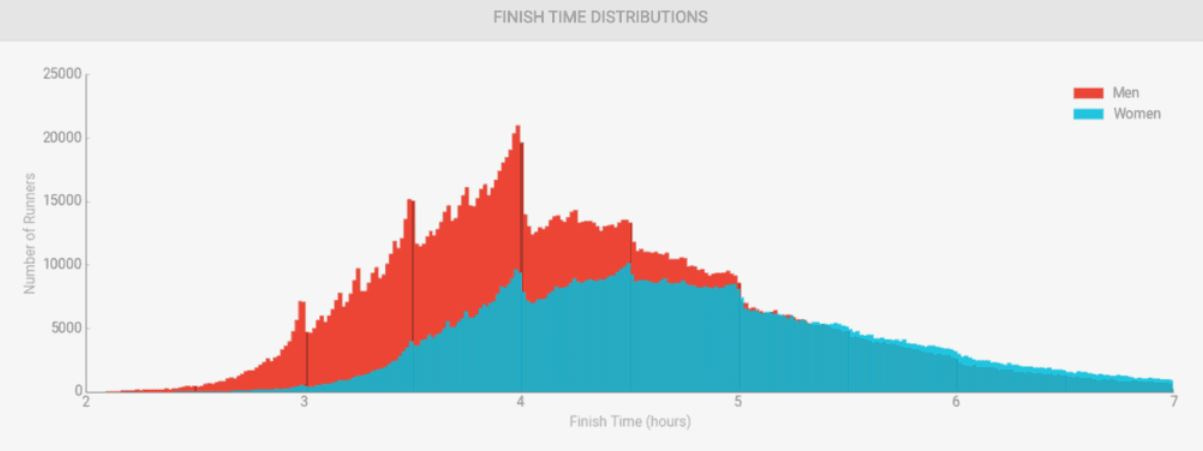
What you often see do the rounds in the aftermath of the London Marathon, is a version of the chart below which uses that same chip data to create a visualisation of finishing times distributed between the elites, the fun runners and the runners probably not having too much fun at the back.
The reason why I love this visual and ones like it is that it shows just how much a motivating factor a specific goal becomes, both in the race and the preparation for the race to finish under 3 hours, 4 hours or those 10 minute intervals in-between.
Goals, KPIs & Actions
If the “Goal” is to go sub 3 hours, the associated “KPIs” and “Actions” to borrow language from our world, that will lead you there, are widely known.
You’ll need to be able to run a sub 1hr 25 minute half marathon, at approximately 6:30 per mile and a sub 38 minute 10K at 6:00 per mile.
Ouch.
To be able to train your body to run at that speed for that long, you’ll need to be running over 35 miles per week and get your bum out on the road pretty much most days.
Major faff.
But marathon running, much like marketing communications, has people participating for very different reasons.
If your goal isn’t about how fast you run, but how much money you can raise for a good cause, your KPI won’t be clock based, but may be about how many headlines you can generate about the way you’ll run the race that can open people’s hearts and wallets.
Cue rhino outfits, washing machines on backs and old heavy diving suits.
Which got me thinking about what to write for this post.
In our discipline, unless you have a clear goal and associated set of KPIs and measures to plan for and keep you on track, much like a marathon runner rocking up and running on vibes… there’s absolutely a chance you could go under 3 hours, but it’s more than likely you’ll end up towards the back of the pack.
You can quickly lose your motivation too.
Hence for this post K is for… KPIs
Where I’ll help you get to grips with the metrics that matter and how they connect with one another, to give you a better sense of how you might advise your clients and colleagues accordingly.
Starting on the client-side I’ll walk through the levels of scrutiny and sophistication that (do or don’t) go into the assessment of how well marketing is creating demand and winning customer preference in the boardroom.
I’ll then flip to the agency-side and share a simple template for a KPI dashboard that you can flex when planning a specific campaign, to create milestones across campaigns, or reference in-flight to optimise specific aspects of what you’re trying to achieve.
Let’s start on the client-side
Marketing’s relation to the bottom line can be succinctly described as “winning customer decisions”.
Winning those decisions, be they considered or on autopilot, to choose you, to stay with you or to demand more from you, are critical to the overall health and ability of businesses big and small to generate wealth today and into the future.
In an ideal world…. a marketer, their management board and their agencies will have a clear understanding of how well they are steering decision making in the market they’re trying to win within, and what’s required to move those measures onwards and upwards.
The marketer will be able to clearly correlate their marketing activities to subsequent market results and understand how they impact the bottom line.
The management board can see that if they invest in building “future demand” they’ll be better positioned to win more of those consumer decisions in the future.
The thing is no brand I’ve worked with has had a perfect set of measures.
Even if they have a solid sense of what’s working, key measures evolve owing to external changes and internal challenges.
They may not even be built yet if it’s a brand that’s scaling up.
But they tend to sit somewhere on a spectrum first mused by Tim Ambler some 20 years ago that I’ve paraphrased below. Have a think about where your client, or organisation, or ones you’ve worked with in the past sit on this spectrum relative to one-another.
1. No assessment at all – Going off vibes
This characterizes companies where the idea of marketing performance or the assessment of what’s working or what isn’t working has not yet even risen, this could be because they’re a scale-up where things are going really well, say Peloton at the start of the pandemic, or management are yet to see the value in using their time to drill down into activities that aren’t seemingly impacting their bottom line.
However, what these companies neglect is that market conditions may change, consumer needs may shift, which may take them by surprise and cause serious damage.
2. Marketing assessment from just a financial point of view – ROAS / ROI
In this case, top management is mostly preoccupied with the financial figures, determining that marketing, as well as other functions, is evaluated only by means of revenue, and profits – judging and releasing resources on this linear basis.
Examples of this could be app-related businesses using various performance marketing tactics to drive app installs, or marketers working every $ invested back to an immediate cost per acquired customer or transaction.
The weak point in this set-up is that financial evaluation lacks the assessment of the sources for cash flow and it only reflects effects, and not the causes of those effects – i.e. whether you have a persuasive offer that is suitably understood by your target market.
3. Balancing financial and non-financial metrics – Analysis Paralysis?!
At this stage, management has realized financial indicators alone are not enough, thus a multitude of non-financial metrics that are indicators for future potential performance are introduced across the company’s functions, including marketing.
Although creating a wider perspective on performance, this situation usually involves balancing the volume and value of metrics and can start to become a burden on resource – as regular dips of brand health tracking can start to add up the more bespoke and nuanced you require them to be.
If not treated with caution, measures get layered upon measures, until the system becomes overwhelming and confusing, with the value added becoming limited considering the efforts that go into the collation of this understanding.
4. Development of a market focus – Getting specific and directional
At this point, the overwhelming variety of metrics require streamlining, to a collection of indicators that give a single coherent view of the market that a business is trying to win within – and how well your activities are impacting that dynamic.
In attempting a more focused and rationalized approach, the problem in this stage remains the question of whether the metrics selected are the “right” ones.
A tight set of indicators can be a good thing to maintain comparable data over time, but also a bad thing if you’re measuring the wrong things.
Therefore…
5. Adopting a scientific approach to measuring performance – Hard sums and hard choices
This stage involves an even more refined process of selecting the right performance measures, by combining quantitative and qualitative analysis to the database of past and current metrics in order to provide the shortest and most relevant list.
Where possible, this analysis would reflect which metrics used in the past were best to predict current performance, and although it cannot be guaranteed for sure that they would predict future performance, it would be a good starting point for preparing the pool of the most representative metrics for top management to choose from.
So where might you, your client or colleagues sit?
These questions I’ve paraphrased from Tim again might help you ascertain whether there could be a business case to help them increase their levels of sophistication.
Does the exec team regularly and formally assess marketing performance?
(a) Yearly (c) Quarterly (d) More Often or (d) NeverHow much time does the exec give to marketing issues vs. financials?
What %? - research has indicated less than 10% of discussion is related to “future demand” within board discussionsDoes the business or marketing plan show non-financial corporate goals (e.g. Brand Equity of X by Y) and link them to financial goals?
(a) No (b) Corporate no / marketing yes (c) Yes to bothDoes the plan or assessment of performance contextualise performance with that of competitors or the market as a whole?
(a) No and no plan to (b) Yes, clearly (c) somewhere in-betweenWhat is your main marketing asset called?
(a) Brand Equity (b) Reputation (c) Another term (d) We have no term!Have the exec qualified what success looks like for that asset in 3, 5 or 10 years time? (a) No (b) Yes (c) That’s a good idea
Does your plan have quantified milestones that indicate progress towards that future success? (a) No (b) Yes (c) Errrrrrrr
Are the marketing performance indicators seen by the exec aligned with these milestones? (a) No (b) Not yet (c) Mostly (d) Of-course ; )
Marketing is an imperfect science (that’s what makes it so interesting) but what sets apart an intuitive marketer and media practitioner, from a more methodical one, is the ability to start creating specificity and where appropriate accountability around these measures to be able to answer questions like these.
Not just to advise on what the right thing to do might be, but to spot the red flags too when you encounter them in the x-agency set-up.
So let’s flip into how we might do that for our clients and colleagues.
Agency-side. Calibrating connected KPIs that teams can collectively work towards
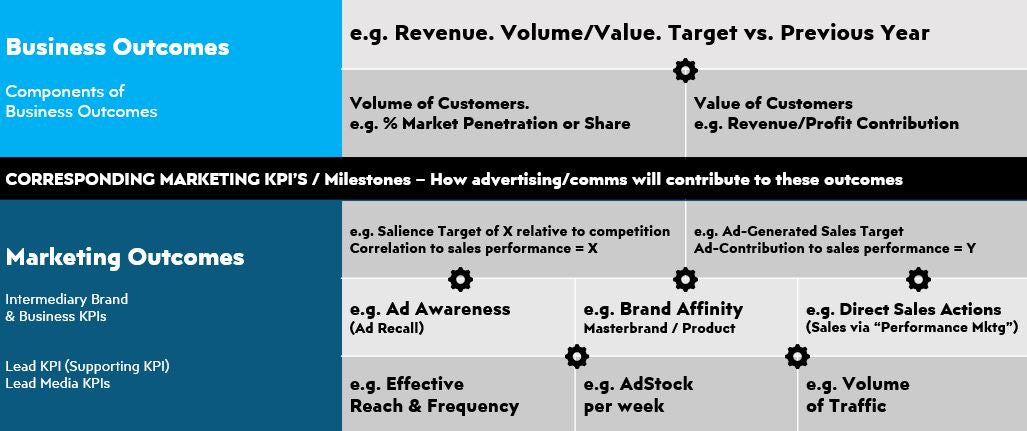
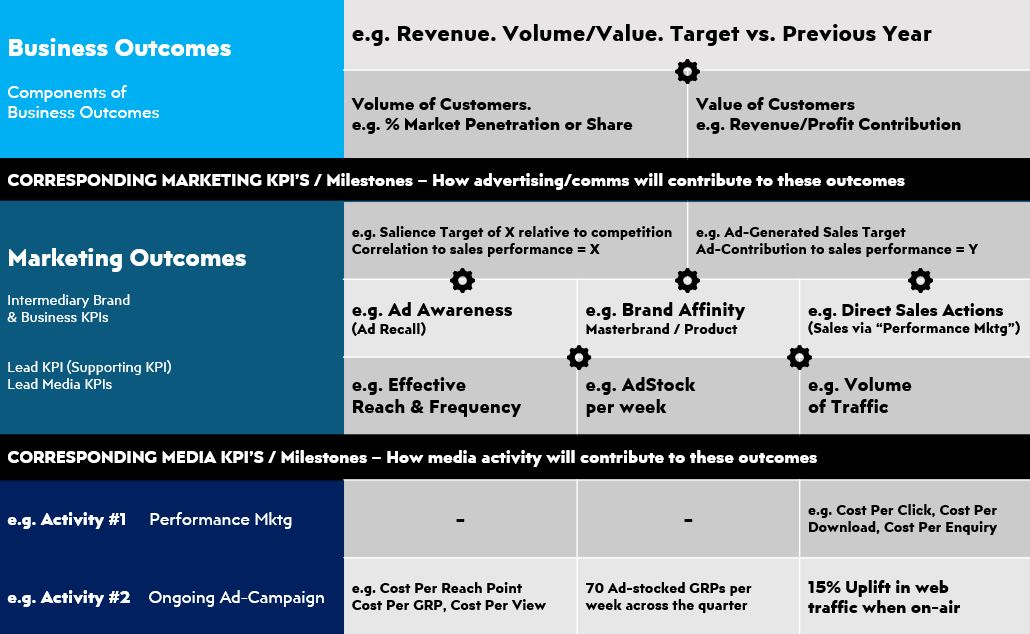
The outcomes we’re attempting to move onwards and upwards can be represented much like gears in an engine.
Desired business outcomes being turned by the marketing milestones achieved, contributed to via good quality advertising and communications, that have been created and suitably distributed.
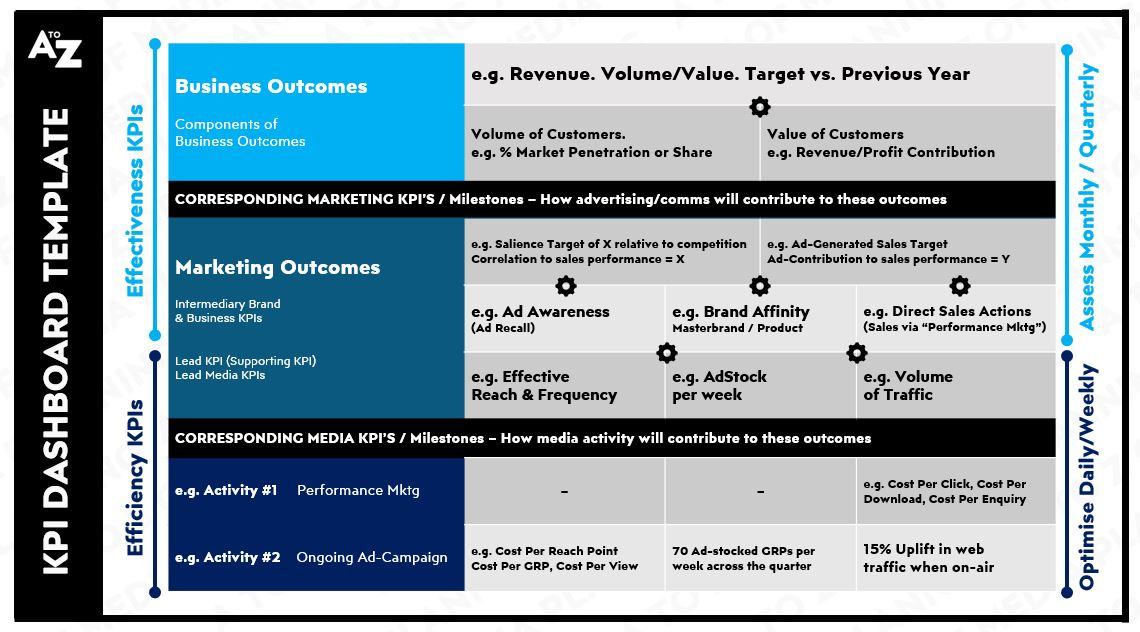
Through 3 simple steps, anyone can create a KPI dashboard to give a better sense of what’s going on and what actions are required to change it for the better.
Let’s dive into them.
1. Get forensic about your goals
Those Business Outcomes I alluded to earlier, being the ultimate measure of success.
Don’t just represent the generic “Sales of X”, “Growth of Y” or “Share of Z”.
Be specific like a serious marathon runner would, to make those milestones tangible and motivating as you move towards them, by breaking that goal into its constituent parts.
This would be the first and most important layer of the dashboard.
On one side this might be the target volume of customers.
This is often represented as a target penetration figure, the numbers of people we need to recruit and re-recruit into the brand in which time period.
On the other side this might represent the equivalent value of those customers.
This could be the revenue/profit they will individually or collectively need to contribute back to the business to hit plan.
Once you have these in situ you can then start to move to the next set of gears that evidence suggests will most effectively move these measures.
2. Organise the levers advertising and communications activities can pull
For those specific business goals, determine which marketing milestones are the ones a brand needs to pass, in which timeframe, to achieve those goals.
A simplified version of this is represented below, which lines up the required marketing outcomes with their twinned business outcomes.
A healthy dose of correlation and causation will start to move you from talking about these goals in a notional sense, to creating more specific milestones.
For businesses that are direct to consumer and/or transacted online, you can be very specific as you will have a clear line of sight between the inputs (the advertising) and the outcomes (web visits -> acquired customers -> average revenue per customer).
For most other businesses that are sold indirectly to the customer, say CPG, you will have to find indirect measures that most strongly correlate to the volume and value of the customers whose decisions you need to influence.
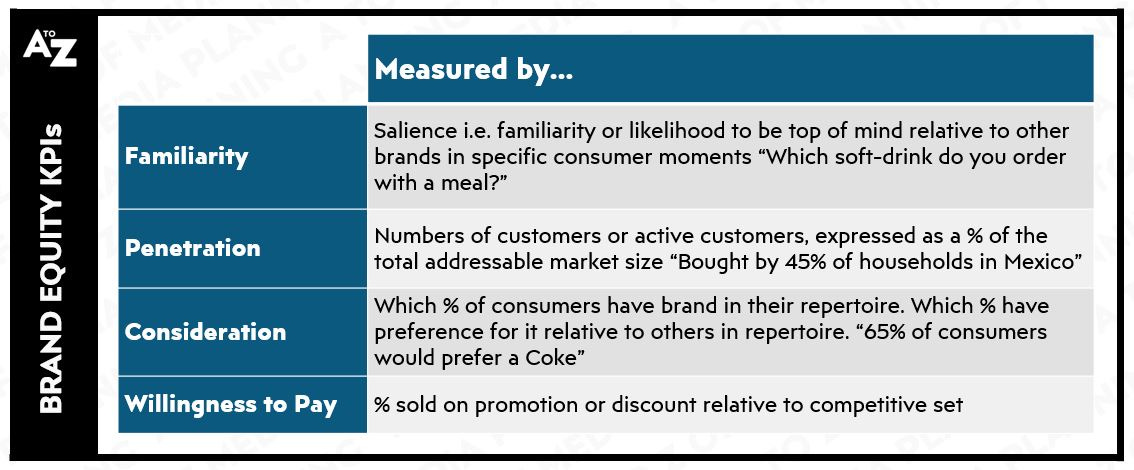
I’ve included some consumer related examples in the graphic below, but these can be extended to other forms of customer and colleague based equities.
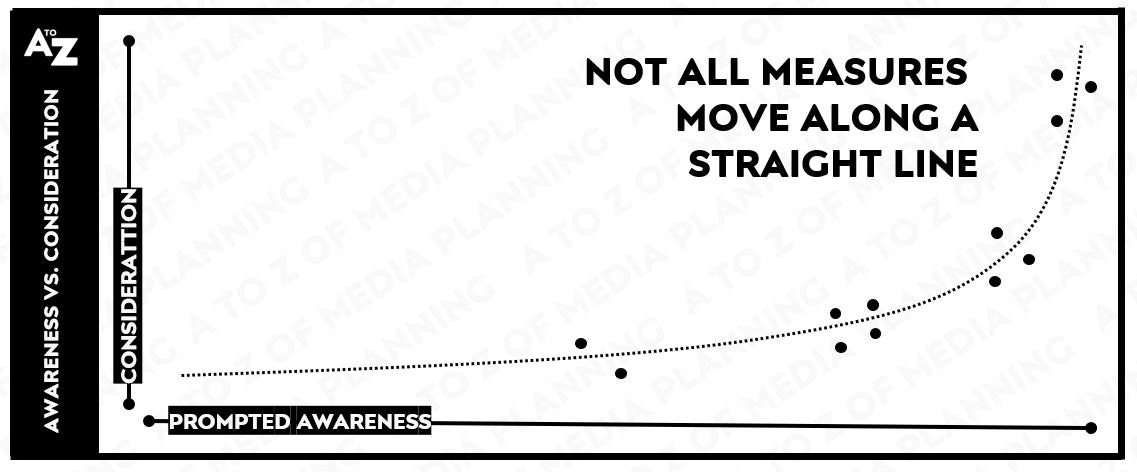
If you’re in a position to be able to track these types of measures across time, a waterfall effect of KPIs can be created like the illustrative example below for consumer related measures…
…that if you then expand to understand what these look like for your competitors, you may discover a particular threshold of say spontaneous awareness or consideration that once crossed, may unlock a more lucrative step-change in potential business performance.
By getting to know the performance of the market you’re trying to win within, not just how your brand performs in a market, you can start to contextualise what the upside for senior management might be if they can increase brand equity – and what the “real” challenges to growth are.
3. Pull everything down into the associated media and channel level KPIs
Once the lead marketing milestones have been statistically linked to the target
business outcomes, you can then start to connect the associated “Brand & Business”
KPIs with their associated “Advertising & Media” KPIs – albeit at a headline level - they can be expanded upon in extensions to a one pager like this.
These will vary, but tend to fall into three categories.
Cost-Led metrics that will determine how many people can be effectively reached.
Broad reaching activities time and again have been evidenced to be the most effective.
Depending on the nature of the task, you may benefit from layering in the attentiveness of the different channel and format choices available too and incorporating any creative pre-testing results in your value equation.
Presence-Led metrics that determine how frequently and recently a brand is refreshed in consumers minds.
Be this the way activity is flighted.
Effectiveness gains in the 10s of percentage points can be unlocked by running activity for longer. If you’re interested in how this is possible I dedicated a post to it which can help you become a jedi flighter and make significant gains with relatively minor adjustments.
Or be this the level of presence relative to the competition.
As a brand’s share of advertising investment vs. its competitors, relative to its share of market, has been proven time and again to be indicative of what its share of market may become in the future.
Which of these is suitable will likely depend on the competitiveness of the sector and its reactiveness to advertising.
Lastly Action-Led metrics can determine how many actions that lead to a sale are directly or indirectly attributable to the advertising and promotional activity that’s running.
This is straight-forward with the likes of paid search or on retail media that is traded on a “per action / click” basis, being optimised to a specific measure, but will require more complex statistical analysis for indirect drivers of actions across broadcast media that may be aiming to shift “brand” measures that also happen to get people clicking too.
So there you have it…a KPI dashboard template on a slide
The important thing to note with any dashboard such as this is you shouldn’t obsess over every number at every moment.
The efficiency metrics at the bottom can be reported more frequently and optimized towards in real-time by the specialists responsible for delivering them.
The effectiveness metrics towards the top might require less frequency, but will require more interrogation and resource on an ongoing basis to run regular dips of brand tracking and marketing-mix-modelling – ensures everything is pulling in the right direction and we’re as right as we can be on the reasons why that’s the case.
So…How might this level of rigour can benefit you, and your clients
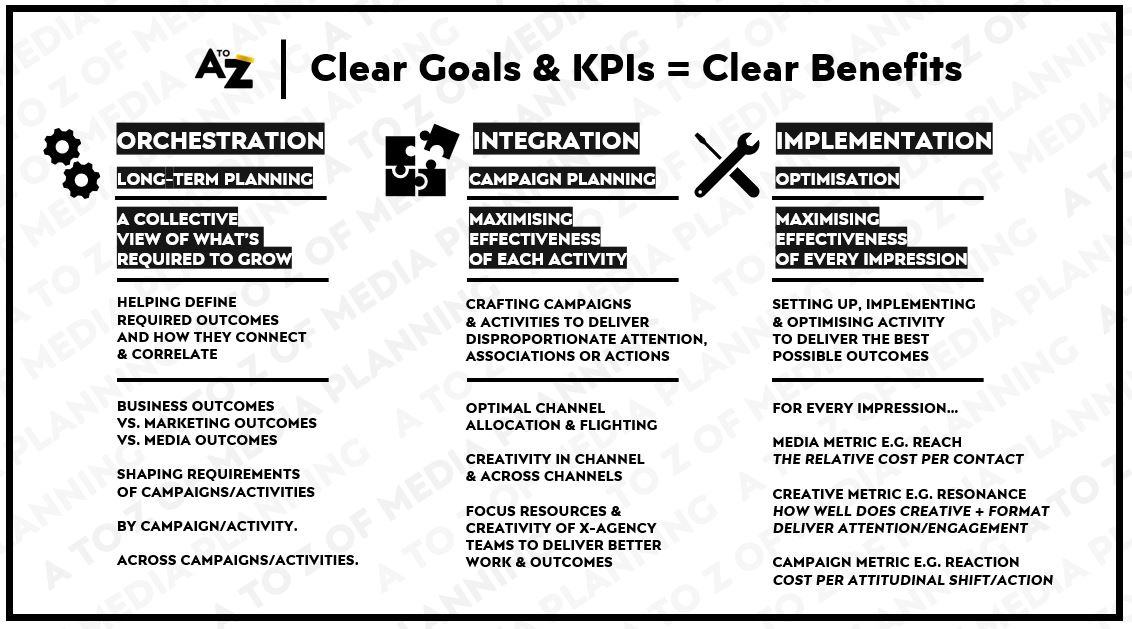
Once you have a solid foundation like this, you can start to extrapolate the measures from the longer-term milestones like I’ve worked through in the above template, into shorter term campaign planning imperatives and in-flight optimisations.
Or simple news updates for senior management that are relatable - to help clients orchestrate, integrate, implement and lobby for investment in campaigns with much more courage and conviction than they otherwise might…
…that depending on the nature of the client you’re working with, or the client-side organisation and culture they sit within, can help you get a seat in much more upstream conversations and steer them in your favour.
Well that’s that for this one.
I hope you’ve found something of use, or something you might use in the near future.
Until next time : )




This is really great and I am loving this series.